20 years of changing seasons on Earth packed into 2½ minutes

AP17321596978201.jpg

By MARCIA DUNN, AP Aerospace Writer

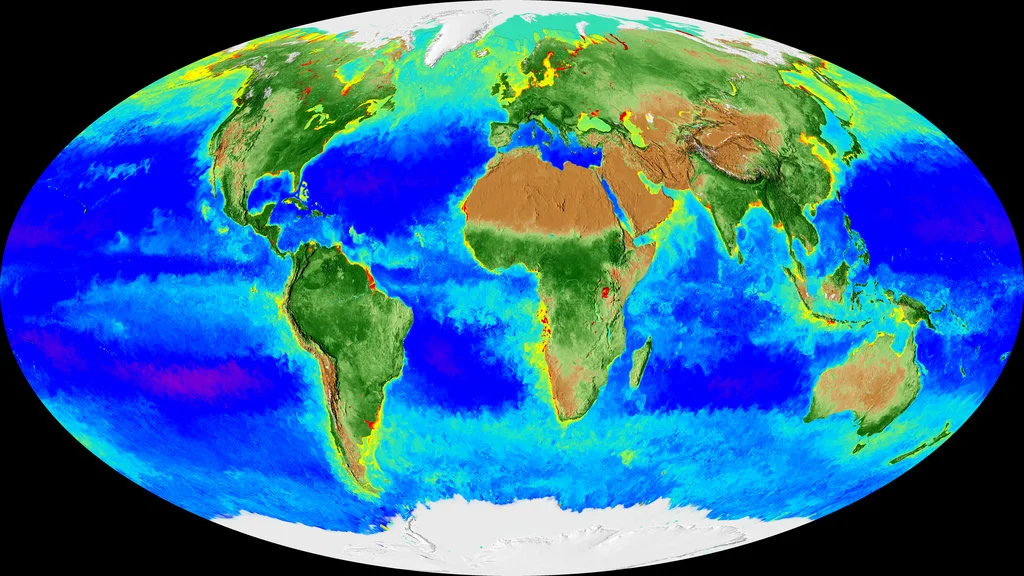
CAPE CANAVERAL, Fla. (AP) — NASA captured 20 years of changing seasons in a striking new global map of the home planet.

The data visualization, released this week, shows Earth's fluctuations as seen from space.

The polar ice caps and snow cover are shown ebbing and flowing with the seasons. The varying ocean shades of blue, green, red and purple depict the abundance — or lack — of undersea life.

"It's like watching the Earth breathe. It's really remarkable," said NASA oceanographer Jeremy Werdell, who took part in the project.

Two decades — from September 1997 to this past September — are crunched into 2 ½ minutes of viewing.

Werdell finds the imagery mesmerizing.

"It's like all of my senses are being transported into space, and then you can compress time and rewind it, and just continually watch this kind of visualization," he said Friday.

Werdell said the visualization shows spring coming earlier and autumn lasting longer in the Northern Hemisphere. Also noticeable to him is the Arctic ice caps receding over time — and, though less obvious, the Antarctic, too.

On the sea side, Werdell was struck by "this hugely productive bloom of biology" that exploded in the Pacific along the equator from 1997 to 1998 — when a water-warming El Nino merged into cooling La Nina. This algae bloom is evident by a line of bright green.

In considerably smaller Lake Erie, more and more contaminating algae blooms are apparent — appearing red and yellow.

All this data can provide resources for policymakers as well as commercial fishermen and many others, according to Werdell.

Programmer Alex Kekesi of NASA's Goddard Space Flight Center in Maryland said it took three months to complete the visualization, using satellite imagery.

Just like our Earth, the visualization will continually change, officials said, as computer systems improve, new remote-sensing satellites are launched and more observations are made.
 

Click below to watch NASA video:

Monster Hurricanes Attacking the Atlantic

hurricane-elena-space-scf4320-006.jpg

WASHINGTON (AP) — It's not just this year. The monster hurricanes Harvey, Irma, Maria, Jose and Lee that have raged across the Atlantic are contributing to what appears to be the most active period for major storms on record.

And the busiest part of hurricane season isn't even over.

FILE - In this Oct. 19, 2005 file photo, Max Mayfield, the former director of the hurricane center (now retired), draws a line showing one of the possible trajectories of Hurricane Wilma in Miami. It’s not just this year. The monster hurricanes Harv…

FILE - In this Oct. 19, 2005 file photo, Max Mayfield, the former director of the hurricane center (now retired), draws a line showing one of the possible trajectories of Hurricane Wilma in Miami. It’s not just this year. The monster hurricanes Harvey, Irma, Maria, Jose and now Lee that have raged across the Atlantic are contributing to what appears to be the most active period for major storms on record. AP Photo/Alan Diaz)

An analysis of 167 years of federal storm data by The Associated Press found that no 30-year period in history has seen this many major hurricanes, this many days of those whoppers spinning in the Atlantic, or this much overall energy generated by those powerful storms.

Scientists caution it is too soon to draw conclusions from the data, and they don't say the intense activity confirms a trend. Storms in the distant past may have gone unnoticed, which could make earlier generations appear quieter than they were. Some scientists say past hurricane data is so weak that it's impossible to connect the recent activity to global warming.

But more intense storms are what scientists expect to see as the planet's climate changes because warmer ocean water is fuel for hurricanes. And they say it is important to better understand this current intense period to save lives and prevent worse future destruction.

FILE - In this Aug. 30, 2005 file photo, floodwaters from Hurricane Katrina cover the lower ninth ward, foreground, and other parts of New Orleans, a day after the storm passed through the city. It’s not just this year. The monster hurricanes Harvey…

FILE - In this Aug. 30, 2005 file photo, floodwaters from Hurricane Katrina cover the lower ninth ward, foreground, and other parts of New Orleans, a day after the storm passed through the city. It’s not just this year. The monster hurricanes Harvey, Irma, Maria, Jose and now Lee that have raged across the Atlantic are contributing to what appears to be the most active period for major storms on record. (AP Photo/David J. Phillip, File)

Georgia Tech climate scientist Kim Cobb said it would be "foolish" for policymakers to ignore the data. "We may not have as much data as we would like, but we have enough to aggressively invest in a variety of defenses for coastal communities," she said in an email.

"We face a triple threat of rising seas, stronger winds, and literally off-the-charts rainfall totals."

The Atlantic hurricane season was more intense than normal in 2003, 2004, 2005, 2008, 2010, 2012 and 2016. The 2005 season, which included Katrina, Rita and Wilma, was so active forecasters ran out of names for storms.

Then came this year. Fueled by warmer than normal ocean temperatures and ideal wind conditions, September 2017 had more days with major hurricanes spinning and more overall hurricane energy expelled than any month on record, according to Colorado State University hurricane researcher Phil Klotzbach. Harvey spawned record rainfall. Irma had record high winds in the open Atlantic. And Maria hit the U.S. stronger than the earlier two.

The Associated Press looked at all major hurricanes — not just the small fraction that hit the U.S. — and grouped them into 30-year periods to mirror the 30-year cycles climate scientists use to understand how the climate is changing. The analysis found that in the period from 1988 to 2017:

— There have been 90 major hurricanes, an average of three a year. That's 48 percent more than during the previous 30 years. This hurricane season is at five and still counting.

In this Sept. 11, 2017 photo, debris lies from a destroyed building in the aftermath of Hurricane Irma in Key Largo, Fla. It’s not just this year. The monster hurricanes Harvey, Irma, Maria, Jose and now Lee that have raged across the Atlantic are c…

In this Sept. 11, 2017 photo, debris lies from a destroyed building in the aftermath of Hurricane Irma in Key Largo, Fla. It’s not just this year. The monster hurricanes Harvey, Irma, Maria, Jose and now Lee that have raged across the Atlantic are contributing to what appears to be the most active period for major storms on record. (AP Photo/Wilfredo Lee)

— During the past 30 years major hurricanes have churned for an average of 7.2 days. That's 65 percent more than the average during the previous 30 years. There have been 18.8 major hurricane days so far this year.

— Scientists use a measure called Accumulated Cyclone Energy, or ACE, that factors in wind speed and storm duration to gauge hurricane power. The annual average ACE of the past 30 years is 41 percent more than in the previous 30 years. An average year ACE is just shy of 100 and this year's ACE, with two months still to go, is 204.2.

— Of the last 30 years, nine hurricane seasons were considered "hyperactive" according to the definition used by the National Oceanic and Atmospheric Administration and seven were above normal. Only seven years were below normal.

Was it just as busy for major storms in the 1930s or 1890s? The numbers say no, but scientists won't draw conclusions because they fear a large undercount of storms before the 1960s.

"There's no question that the storms are stronger than they were 30 years ago," said NOAA climate and hurricane scientist James Kossin. "The questions are if you go back a little further if that's what you'll find. We do know for sure that things have increased a hell of a lot since 1970."


So what's going on?

Scientists talk about two important factors for long-term hurricane activity: man-made climate change and a natural pattern of changes in the Atlantic.

The world's oceans go through long cycles as water circulates like a giant conveyor belt. They last 20 to 30 years, carrying water with different levels of salt and temperature. That cycle seems coincide with hurricane activity, Klotzbach said.

Klotzbach predicts that a period of high salinity and warmer water in the North Atlantic that has been present since 1995 will soon fade — and take with it this ultra-busy period for storms. Other scientists dispute this.

In this Sept. 1, 2017 photo, homes are submerged by water from the flooded Brazos River in the aftermath of Hurricane Harvey near Freeport, Tex. It’s not just this year. The monster hurricanes Harvey, Irma, Maria, Jose and now Lee that have raged ac…

In this Sept. 1, 2017 photo, homes are submerged by water from the flooded Brazos River in the aftermath of Hurricane Harvey near Freeport, Tex. It’s not just this year. The monster hurricanes Harvey, Irma, Maria, Jose and now Lee that have raged across the Atlantic are contributing to what appears to be the most active period for major storms on record. (AP Photo/Charlie Riedel)

More frequent and more intense storms fit what scientists expect to see accompany global warming, MIT hurricane and climate professor Kerry Emanuel said. Physics, computer simulations and numerous scientific studies show that as the world warms the strongest storms should get wetter and more intense, and probably more frequent. Yet, the overall number of all named storms is likely to drop because there will likely be fewer weaker ones, scientists say.

Still, scientists say it would take more years — and maybe decades — of good data to know for sure if there's a direct connection to climate change.

National Hurricane Center science officer Chris Landsea said the problems with missing past storms are so severe "making any conclusions for the entire (Atlantic) basin would not be justified" and several other scientists agreed with him.

Climate scientist Stefan Rahmstorf of the Potsdam Institute in Germany said the data showing increased intensity is clear enough for him: "The only caveat being that the increase might be exaggerated somewhat because of undercounting early storms."

What's happening with hurricanes — the frequency, the duration, and the energy — is probably a combination of factors caused by both nature and man, Klotzbach said: "a mish-mosh of everything."

___

AP data journalist Nicky Forster contributed to this story from New York.

___

Follow Seth Borenstein on Twitter at @borenbears . His work can be found here .

___

This Associated Press series was produced in partnership with the Howard Hughes Medical Institute's Department of Science Education. The AP is solely responsible for all content.

Natural Disasters in USA Break Billion-Dollar Records

FILE - In this Sept. 2, 2017, file photo, a crew with California Department of Forestry and Fire Protection (Cal Fire) battles a brushfire on the hillside in Burbank, Calif. If you think this has been a wild and costly year for weather disasters, fe…

FILE - In this Sept. 2, 2017, file photo, a crew with California Department of Forestry and Fire Protection (Cal Fire) battles a brushfire on the hillside in Burbank, Calif. If you think this has been a wild and costly year for weather disasters, federal meteorologists say you are right, it’s been record setting. So far this year the United States has had 15 weather disasters that caused at least $1 billion in damages. (AP Photo/Ringo H.W. Chiu, file)

WASHINGTON (AP) — Howling winds, deadly floods, fire and ice so far this year have pushed the U.S. into a tie for weather disasters that topped $1 billion in damages.

There have been 15 costly disasters through September, tying 2011 for the most billion-dollar weather disasters for the first nine months of a year. The record for a year is 16, and the hurricane season is not over yet. 

The figures released Friday by the National Oceanic and Atmospheric Administration include three hurricanes, three tornado outbreaks, four severe storms, two floods, a drought, a freeze and wildfires.

FILE - In this March 7, 2017, file photo, Mark Swartz salvage items from his son's home that was destroyed by a tornado after a severe storm passed through Oak Grove, Mo. If you think this has been a wild and costly year for weather disasters, feder…

FILE - In this March 7, 2017, file photo, Mark Swartz salvage items from his son's home that was destroyed by a tornado after a severe storm passed through Oak Grove, Mo. If you think this has been a wild and costly year for weather disasters, federal meteorologists say you are right, it’s been record setting. So far this year the United States has had 15 weather disasters that caused at least $1 billion in damages. (AP Photo/Charlie Riedel, file)

NOAA climate scientist Adam Smith said 2017 is shaping up to be an unprecedented year. It is likely to tie or break the record for billion-dollar weather disasters that was set in 2005, the year of Hurricane Katrina and other deadly storms.

NOAA hasn't calculated the costs from hurricanes Harvey, Irma and Maria, but an outside disaster risk company estimates the U.S. damage from the three hurricanes to be around $150 billion. The remaining disasters so far this year have cost more than $21.7 billion and killed 282 people, according to NOAA.

FILE - In this Aug. 29, 2017, file photo, businesses are surrounded by floodwaters from Tropical Storm Harvey in Humble, Texas. If you think this has been a wild and costly year for weather disasters, federal meteorologists say you are right, it’s b…

FILE - In this Aug. 29, 2017, file photo, businesses are surrounded by floodwaters from Tropical Storm Harvey in Humble, Texas. If you think this has been a wild and costly year for weather disasters, federal meteorologists say you are right, it’s been record setting. So far this year the United States has had 15 weather disasters that caused at least $1 billion in damages. (AP Photo/David J. Phillip, File)

Damage figures are adjusted for inflation; records for billion-dollar disasters go back to 1980.

Between 1980 and 2007, the U.S. averaged only four billion-dollar disasters per year. In the decade since, the country has averaged 11 per year.

Experts blame a combination of factors.

FILE - In this Sept. 28, 2017, file photo, damaged and destroyed homes are seen in the aftermath of Hurricane Maria in Toa Alta, Puerto Rico. If you think this has been a wild and costly year for weather disasters, federal meteorologists say you are…

FILE - In this Sept. 28, 2017, file photo, damaged and destroyed homes are seen in the aftermath of Hurricane Maria in Toa Alta, Puerto Rico. If you think this has been a wild and costly year for weather disasters, federal meteorologists say you are right, it’s been record setting. So far this year the United States has had 15 weather disasters that caused at least $1 billion in damages. (AP Photo/Gerald Herbert, File)

"Climate change is impacting extreme weather in ways we hadn't anticipated," Michael Mann of Pennsylvania State University said in an email.

But an even bigger factor is that more people moving into harm's way "has created massive amounts of exposure in regions prone to severe weather events," said Mark Bove, a meteorologist at insurance giant Munich Re.

___

Follow Seth Borenstein on Twitter at @borenbears. His work can be found here.